

Tokenized credit market value fell during the third quarter of 2026 even as the number of blockchain addresses holding these assets increased, according to the Q3 2026 edition of RWA Activity on the Terminal.
The report from RWA Foundation and Token Terminal found that tokenized credit market capitalization declined 2.8% from $6.35 billion on July 3 to $6.17 billion on October 1. Over the same 90-day period, holder addresses increased 12.1% to 28,840.
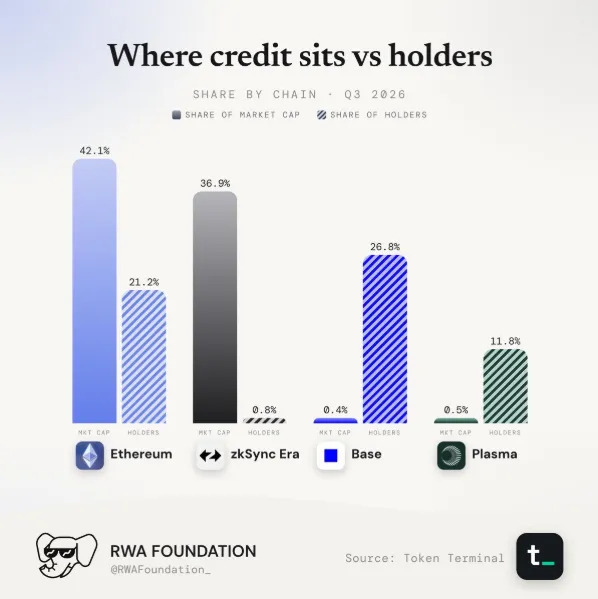
The figures highlight a difference between the location of tokenized credit capital and the distribution of holders. Ethereum and zkSync Era controlled most of the market value, while Base and Plasma accounted for much larger portions of holder addresses.
Source: RWA Foundation
Tokenized Credit Value Remains Concentrated
The report’s market capitalization figures and holder counts measure different parts of the sector. Token Terminal’s market cap data covers circulating asset market capitalization from native deployments and excludes bridged supply.
Holder data follows a broader methodology. It counts addresses with non-zero balances and includes bridged deployments. The figures also sum holders across assets without removing addresses that appear in multiple assets.
Ethereum accounted for 42.1% of tokenized credit market capitalization and 21.2% of holder addresses. zkSync Era represented another 36.9% of market value but only 0.8% of holders.
The distribution was substantially different on Base and Plasma. Base represented 0.4% of market capitalization but 26.8% of holder addresses, while Plasma held 0.5% of market value and accounted for 11.8% of holders.
Issuers Show a Similar Distribution Gap
Issuer-level data also showed a wide difference between capital concentration and address distribution. Tradable represented 36.9% of tokenized credit market capitalization but only 0.8% of holder addresses. Maple Finance accounted for 23.5% of market value while representing 64% of holders.
Together, Tradable and Maple Finance represented 60.4% of the sector’s market capitalization. Centrifuge followed with 9.9%, while Hastra, USDai and Securitize accounted for 9.6%, 7.6%, and 6.2%, respectively.
The report links the difference partly to the types of products issued by these companies. Tradable issues individual loans and notes, including senior secured term notes and project tranches. Such products can represent significant amounts of capital while being held across comparatively few addresses.
Maple, USDai, Hastra, and 3Jane issue pooled yield products distributed across multiple addresses and chains. These four issuers accounted for 3,081 of the sector’s 3,117 net new holder addresses during the quarter.
Maple Adds Holders Despite Market Cap Decline
Maple Finance recorded the largest issuer-level market capitalization decline during the period, losing $402.7 million. At the same time, the issuer added 2,160 holder addresses.
Those new addresses represented about 69% of the sector’s net holder growth. Maple’s three syrup tokens also accounted for 2,160 of the 3,127 new holders recorded among the 10 assets with the largest increases in holder counts.
syrupUSDT added 1,398 holders, representing a 16.5% increase, even as its market capitalization fell 44.7%. syrupUSDC gained 597 holders, while sUSDai added 518.
The figures show why an increase in holder addresses does not necessarily correspond with an increase in capital invested in an asset. An asset can attract more addresses while its market capitalization declines.
Several Assets and Chains Expand
The overall contraction did not affect every asset or blockchain equally. The largest increase in terms of market capitalization belongs to Hastra’s PRIME that rose by $195.9 million.
USDai’s sUSDai increased by $176.7 million, while Maple’s syrupUSDG gained $135.6 million. Thus, the total increase in market capitalization of the top 10 cryptocurrencies reached approximately $689 million.
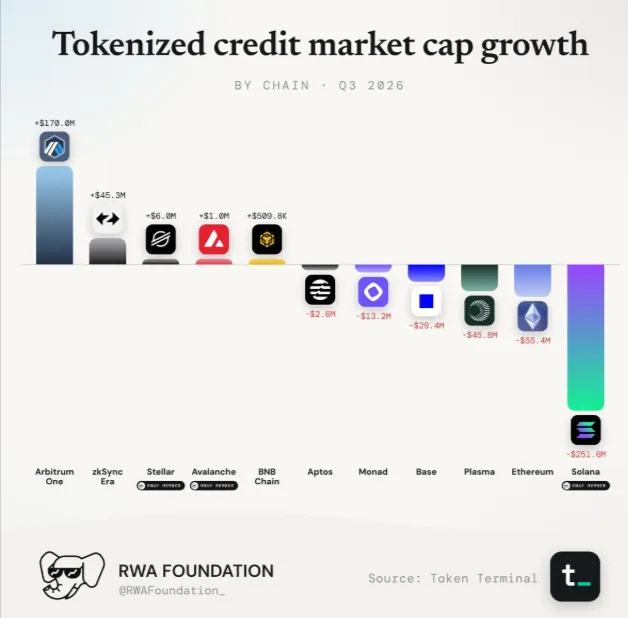
Blockchain-level data revealed growth in several networks. Arbitrum One added $170 million and nearly doubled its tokenized credit market capitalization to $342.6 million.
During this time frame, zkSync Era raised $45.3 million, and Stellar earned $6 million, whereas Avalanche gained $1 million.
The above figures were recorded when the total market cap of the industry decreased by $175.5 million. It is clear from the above numbers that capital generation took place in selected assets and networks.
Holder Growth Does Not Equal Investor Count
The Q3 figures provide separate measures of the tokenized credit market’s size and distribution. Market capitalization shows where asset value is concentrated, while holder addresses indicate how widely balances are distributed across blockchain addresses.
Source: RWA Foundation
The holder measure also has limitations. The blockchain address is not necessarily a representation of a single individual or entity, and the process does not exclude any duplicate addresses that may exist on different securities.
Consequently, the increase to 28,840 addresses is to be viewed in terms of increased distribution in addresses rather than a number of investors. The decrease to $6.17 billion in market capitalization, on the other hand, indicates that while distribution has been widened, there has been a fall in overall value.