
XRP is hovering around $1.47 after its sharp August run-up. The token came close to $1.65 before giving back some gains, falling nearly 7% on September 24. Still, the pullback has not pushed XRP below the key Ichimoku levels on the daily chart.
XRP started August near $1 before moving above $1.50. Since then, the picture has become less straightforward. Santiment data shows larger wallets changing their positions, while network activity has eased from the highs seen during the rally.
Large XRP Wallets Shift Holdings
Santiment groups XRP wallets by the amount of the token they hold, with categories starting at 100,000 XRP and extending beyond 10 million XRP.
The 1 million-to-10 million XRP category saw a notable increase during the August rally. These wallets held about 5.44 billion XRP before the move. Their combined balance later rose past 5.52 billion XRP.
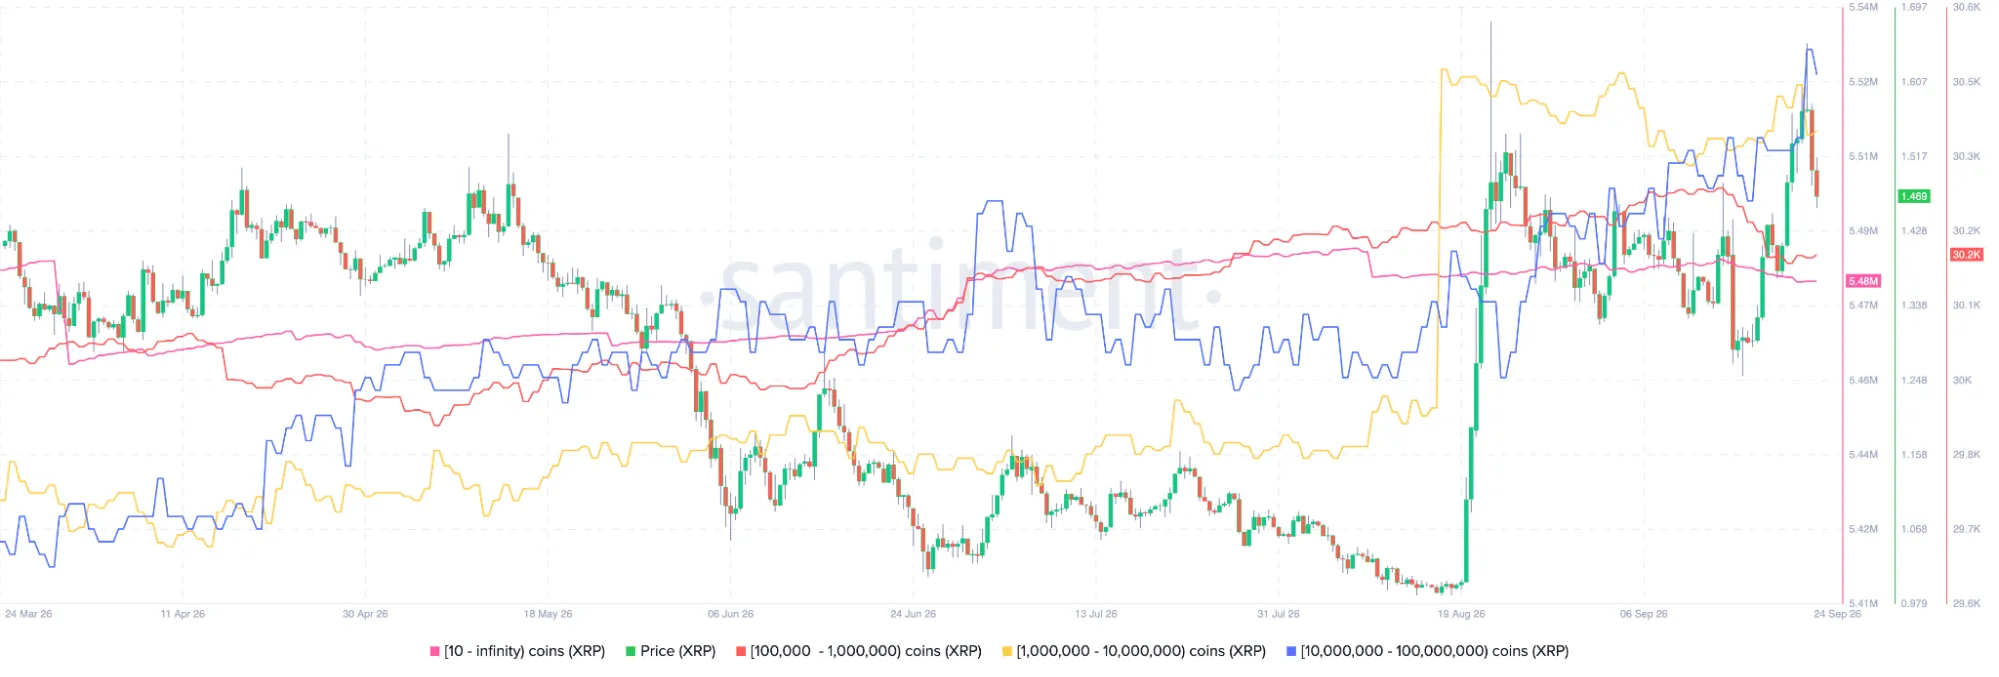 XRP supply distribution metric, Source: Santiment
In total, that represents roughly 80 million additional XRP. The increase came as the token moved above $1 and later approached the $1.50 level.
Larger wallets were active too. Holdings among addresses with 10 million to 100 million XRP increased during the period, although the changes were less consistent than those seen in the 1 million-to-10 million range.
The smaller 100,000-to-1 million XRP group followed a more gradual pattern. Its holdings reached about 30.2 million XRP by September.
The largest wallet category showed relatively little change. Taken together, the figures suggest that XRP accumulation was concentrated in some wallet groups rather than spread evenly across the market.
XRP Network Activity Cools After August Surge
The August rally was accompanied by more activity on the XRP Ledger. Santiment’s data shows daily active addresses climbing during the month, while network growth also accelerated.
Those numbers have come down since the rally.
On Sept. 24, Santiment counted about 17,100 daily active addresses. Network growth was roughly 2,436. Both figures were below the highs recorded in August.
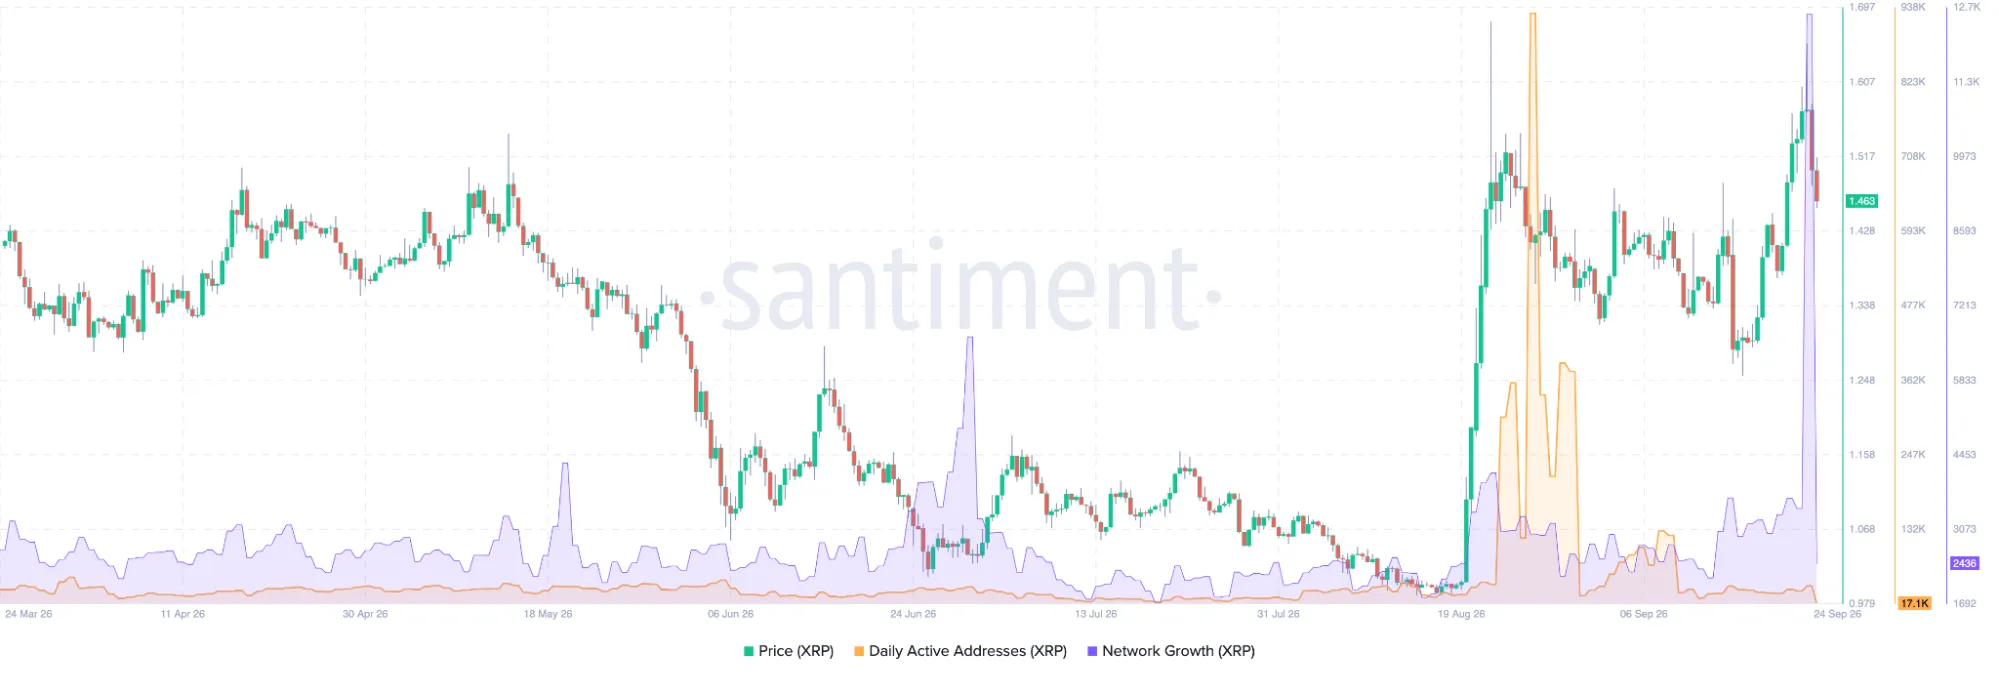 XRP network growth, Source: Santiment
The price has followed a different path. XRP remains above the lows reached in July, despite the slowdown in network activity.
That leaves a mixed picture on-chain. The token has retained part of its recovery, but fewer addresses are currently active than during the August surge. Whether that changes will depend on how network activity develops from here.
XRP Holds Key Technical Support
XRP was trading at about $1.47 on TradingView on Sept. 24. The recent decline has not pushed the price below the Ichimoku cloud yet.
Both the conversion line and the baseline were close to $1.45. That makes the area important in the short term, since it is only slightly below where XRP was trading.
The next level on the downside is the lower part of the cloud, near $1.34. On the other side, the chart shows resistance around $1.60 to $1.65. That was roughly the area where the previous advance stalled.
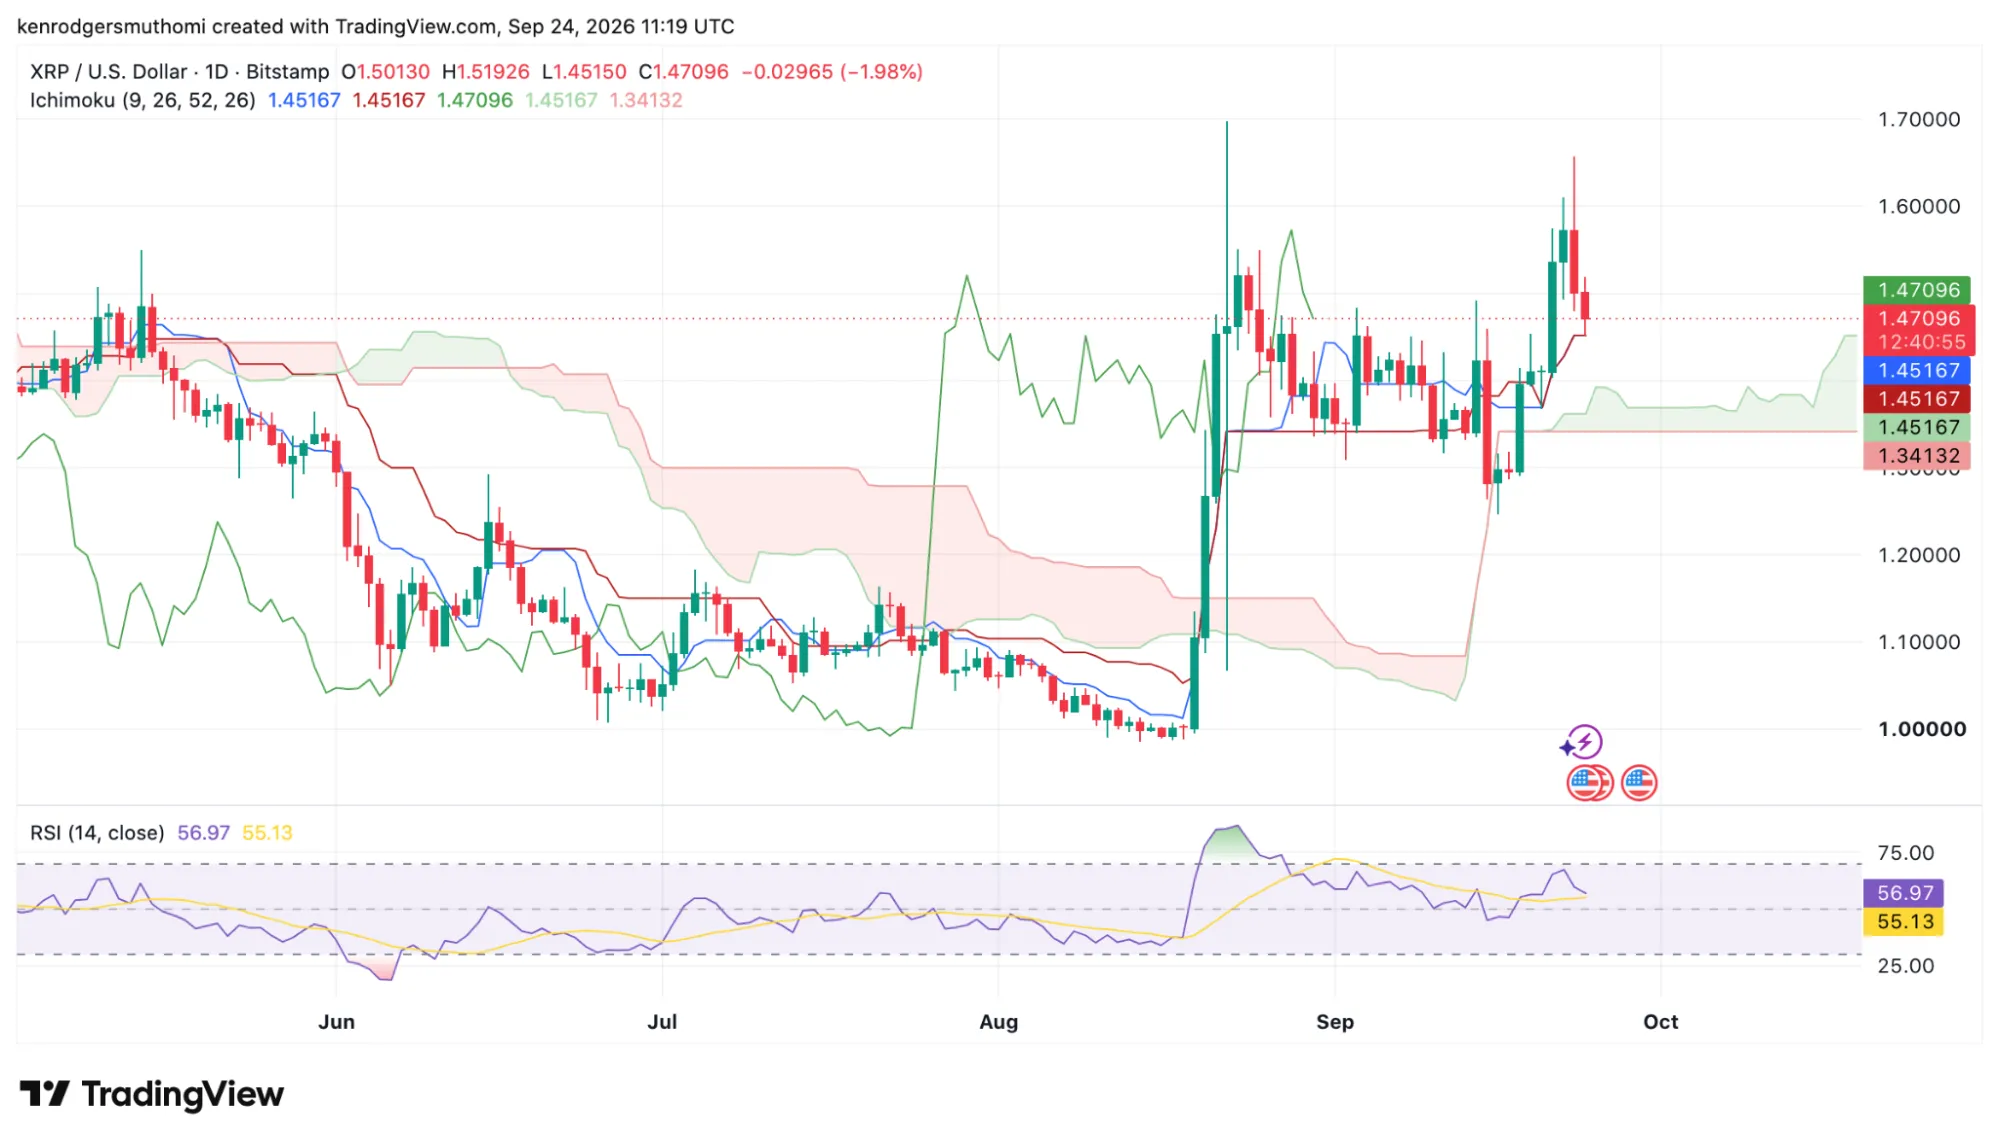 XRP daily chart, Source: TradingView
The RSI was at 56.97 on the 14-day setting. Its signal average was around 55.13. So far, the indicator is pointing to positive momentum, but the reading is still below the usual overbought zone.
$589 XRP Target Returns to Debate
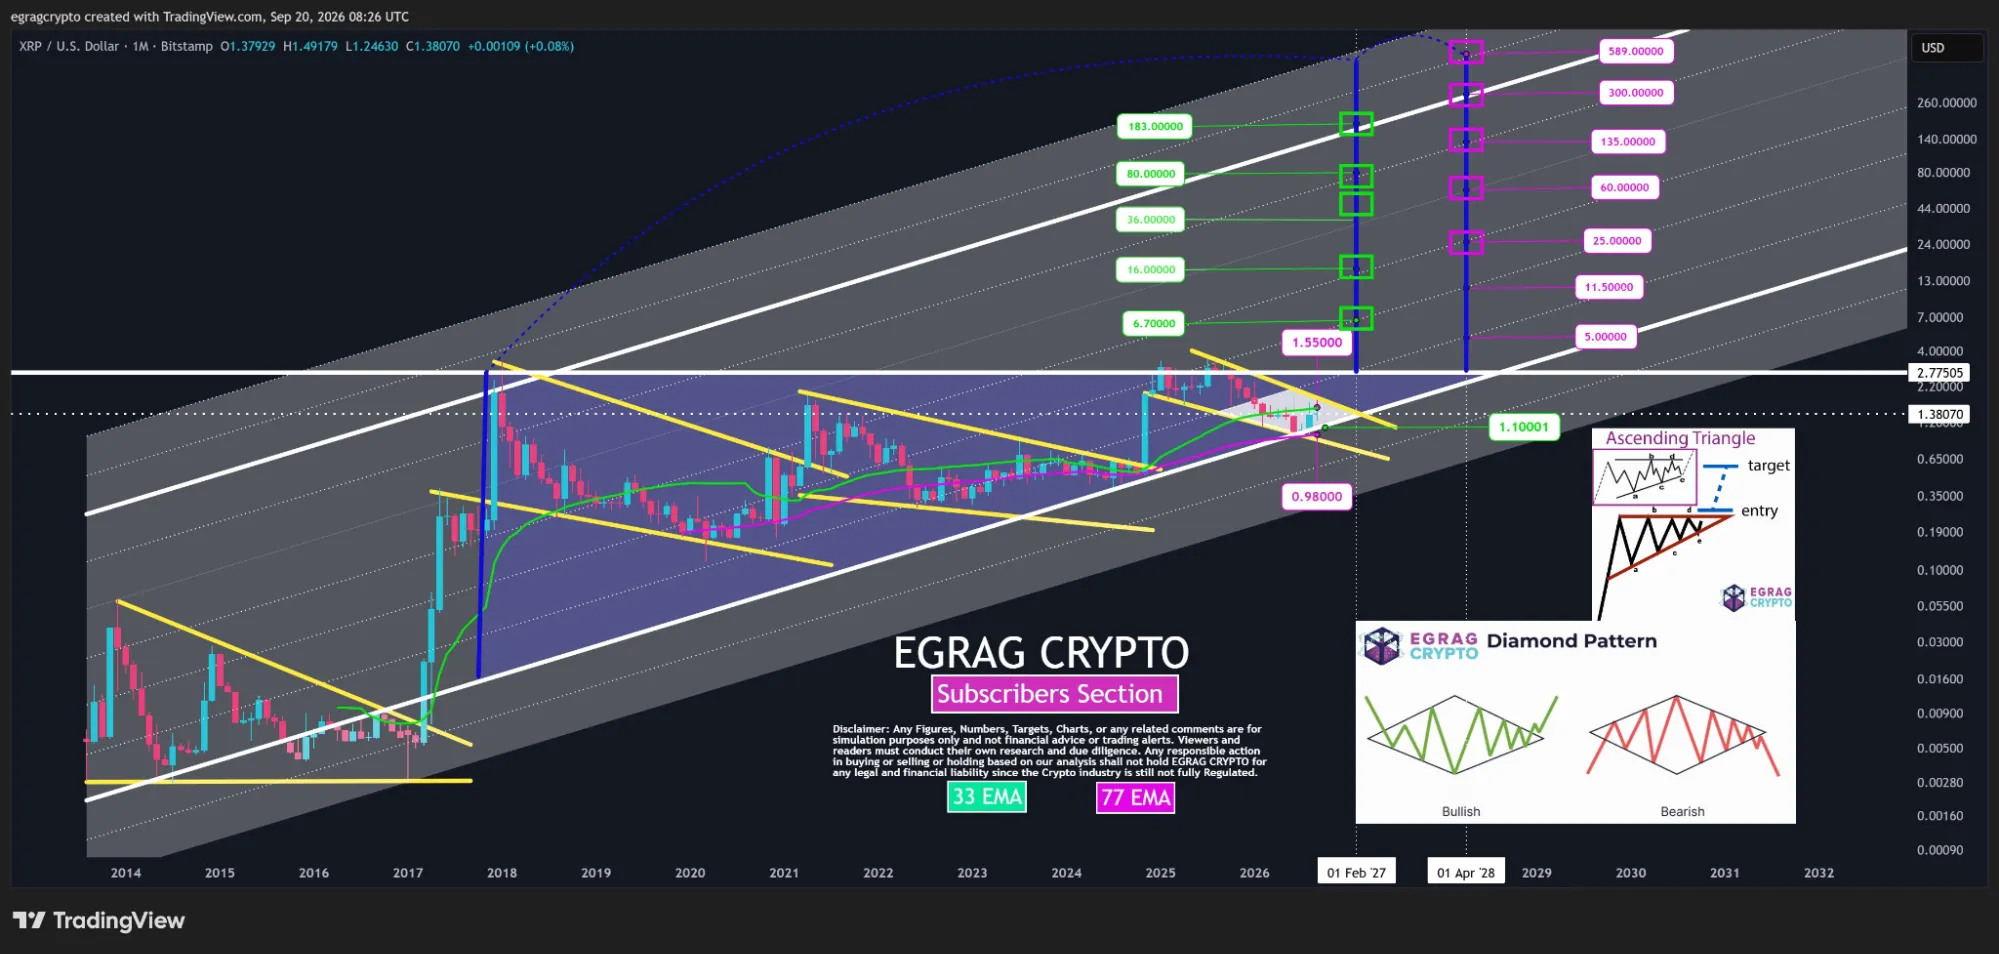
The $589 XRP figure is still being discussed in parts of the crypto market. Egrag Crypto recently placed it near the top of an ascending-channel chart covering several possible long-term levels.
The chart starts with $5 and then moves through $11.50, $25, $60, $135 and $300 before reaching $589. Egrag presents these as levels in his technical analysis. They are not confirmed targets.
“I’m not trying to predict WHEN XRP reaches its destination. I’m mapping the potential COORDINATES based on the macro structure,” Egrag said.
 Source: Egrag Crypto (X)
The $589 number was already familiar to XRP followers before Egrag used it. It was connected to Bearableguy123, an anonymous account that became known for posting puzzles and unusual images in 2017 and 2018.
Among those posts was an image of an astronaut carrying bagpipes on the Moon. Some XRP followers later connected the image to the $589 figure.
The theory came up again after David Schwartz, an architect of the XRP Ledger, shared a GIF featuring bagpipes. Some members of the XRP community saw the post as a possible reference to the old speculation.
Schwartz did not say that was what he meant. His response was a joke about the bagpipes: “When the pipes started playing, it often meant it was time to move… away from the bagpipes.”
https://x.com/Bird_XRPL/status/2102126116500619610
Technical Conditions Remain in Focus
Egrag’s long-term chart has a few conditions that have not been met yet. XRP needs to remain above its 77-month exponential moving average and get back above the 33-month EMA.
His analysis also tracks a descending resistance line formed by a large diamond pattern. A move through that line would give the setup another technical confirmation.
For now, the $589 and other higher levels should be viewed in that context. They are part of Egrag’s model, not established destinations for the price.
The immediate levels are much lower. XRP was around $1.47 on Sept. 24 and was trading just above the $1.45 area. The next resistance zone is $1.60 to $1.65. A decline from current levels could put $1.34 back on the chart.
The blockchain data adds another part to the picture. Some large wallets have been adding XRP, while network activity has fallen from its August highs.
For the moment, price and network activity are not moving together. The price has held above nearby support, but the network has not seen the same level of activity that accompanied the August rally.